
Analyzing the 2016 elections
Elections are a treat for data enthusiasts. This elections, even more so ! Every single poll in the US predicted a landslide for Hillary Clinton. Below is an infographic from the New York Times:
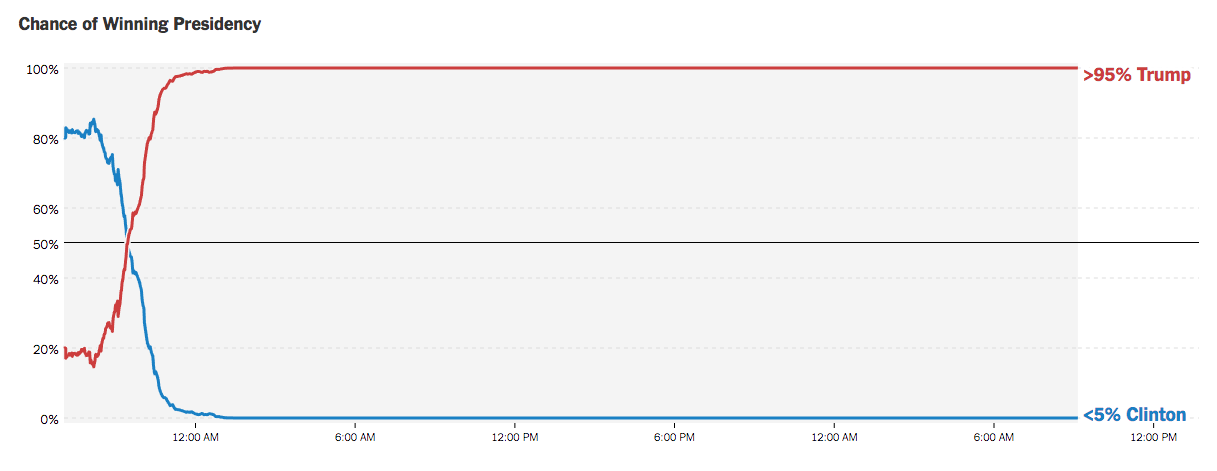
The chances of Trump winning Presidency before results started coming out was around 15% ! Everyone got it wrong and in the end he won 306 seats. Being curious, I download the data from AP and turned on my Jupyter notebook. The truth is this could have been a lot worse!
The elections had two major candidates: Hillary Clinton from the Democratic Party and Donald Trump from the Republican Party. But in the fray were many other candidates, two of which took a good share (>1%) of the vote share: Jill Stein from the Green Party and Gary Johnson from the Libertarian Party. The Green party is more liberal than the Democratic; the Libertarians are more conservative than Republicans.
{% asset_img candidates.jpeg %}
If we consolidate the votes of Hillary+Stein vs Gary+Donald i.e.: making a two candidate race, the Dems would have lost 5 more states == 33 more seats. They would lose in Colorado, Minnesota, New Hampshire, Nevada and Maine. Trump would have gotten 339 seats — a landslide. The map at the top shows how it would look like if that happened.
This is truly surprising. Living at MIT in Boston, I have so far spoken to 1 Trump supporter. It is like I so far lived in a bubble. In fact a lot of places have very few supporters of either party. From the data, here are the 10 places with the lowest vote percentage for Hillary and for Trump:
Schema: County, State: Hillary-Vote Percentage, Trump-Vote Percentage,

Counties with lowest Hillary Clinton Vote Percentage
King County, TX: 3.140000, 93.710000
Roberts County, TX: 3.640000, 95.270000
Banner County, NE: 4.620000, 91.030000
Garfield County, MT: 4.750000, 91.200000
McPherson County, NE: 4.900000, 89.860000
Harding County, SD: 4.940000, 90.250000
Piute County, UT: 5.020000, 87.030000
Grant County, NE: 5.080000, 93.150000
Glasscock County, TX: 5.650000, 91.860000
Wallace County, KS: 5.780000, 91.270000

Counties with lowest Donald Trump Vote Percentage
District of Columbia County, DC: 92.850000, 4.120000
Oglala Lakota County, SD: 86.460000, 8.320000
Prince Georges County, MD: 89.330000, 8.340000
Bronx County, NY: 88.730000, 9.590000
San Francisco County, CA: 85.350000, 9.730000
New York County, NY: 87.170000, 9.970000
Petersburg city, VA: 87.520000, 10.560000
Baltimore city, MD: 85.440000, 10.870000
Jefferson County, MS: 86.470000, 12.670000
Clayton County, GA: 85.060000, 13.160000
Boston was a close contender for Top 10. New York, SF and other urban centers are heavily Democratic which is probably what made us feel Hillary was going to sweep. In fact, when we check places with more than 0.5 million votes cast, Hillary wins 33 of them compared to just 3 for Trump. The only ones Trump wins are:
Maricopa County AZ
Suffolk County NY
Tarrant County TX
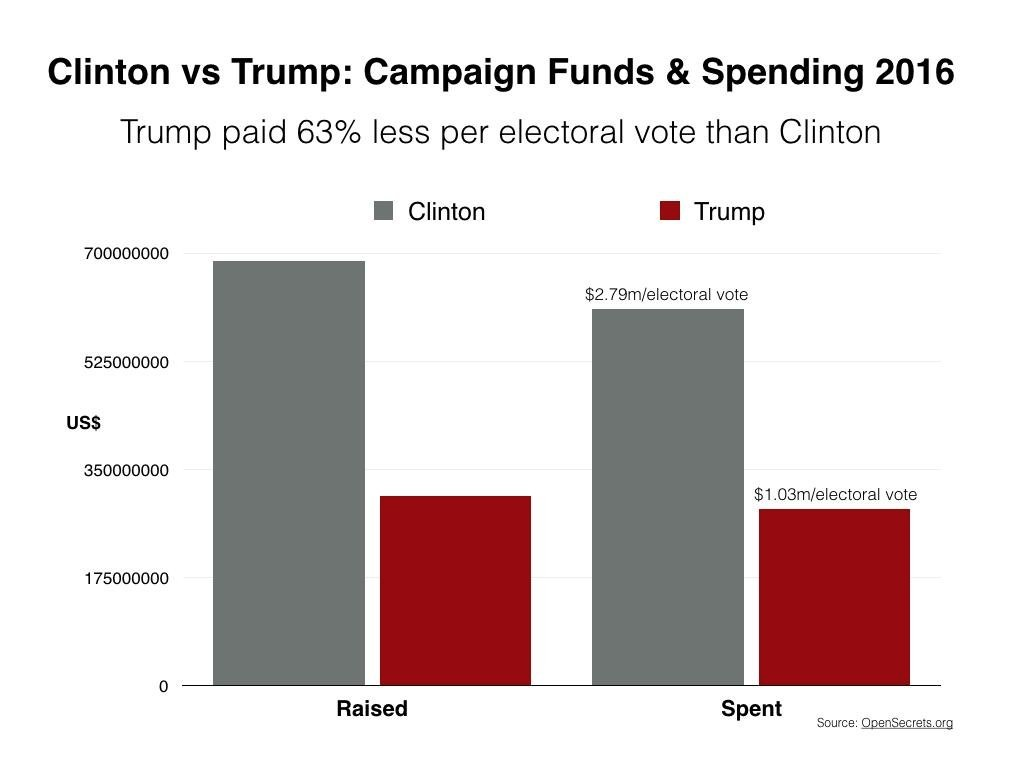
One positive effect of elections was that it showed that it is not always the person with more money who wins. From a previous /r/dataisbeautiful post:
Getting the Data
The Associated Press releases data for the elections. While not free, I found that JSON endpoints powering their election interactive can be downloaded (it is public). All the data and the notebook with the code can be found here. Warn you the data is only for educational uses and may be used for commercial purposes only with AP’s permission.